
Google Chrome Lighthouse vs. PageSpeed Insights: How to Master Web Performance Audits
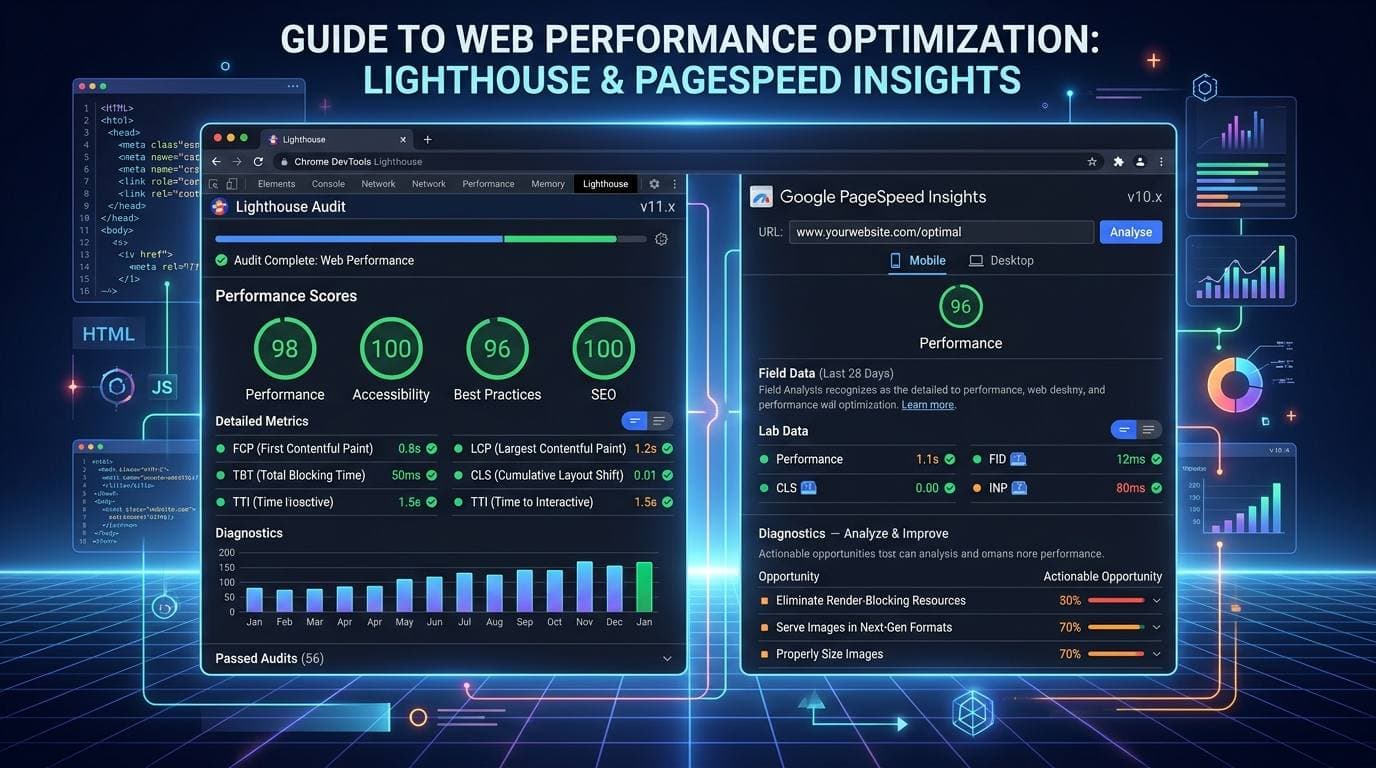
In modern web engineering, page loading speed and technical optimization are no longer optional features—they are core business drivers. Whether you are managing an enterprise corporate website, scaling a high-volume e-commerce storefront, or launching a fast-growing SaaS MVP, your site's performance metrics directly dictate your organic search engine rankings (SEO) and user conversion rates.
According to extensive industry data, a 1-second delay in page load time can reduce conversions by up to 20% and increase bounce rates significantly. Recognizing this shift, Google introduced two primary, free tools to measure, diagnose, and audit web applications:
Google Chrome DevTools Lighthouse
Google PageSpeed Insights (PSI) (accessible at https://pagespeed.web.dev/)
While both diagnostic tools rely on the underlying open-source Lighthouse auditing engine, they operate under fundamentally different testing conditions, measure different datasets, and serve distinct roles in the software development lifecycle. Understanding how to use each tool—and why their scores often differ—is essential for any founder, developer, or business owner aiming for digital excellence.
Part 1: Mastering Google Chrome DevTools Lighthouse
Google Lighthouse is an automated, open-source auditing tool integrated directly into the Google Chrome web browser. It allows developers to test web pages locally under simulated device and network conditions.
Step-by-Step Execution Guide
Open an Incognito Window: Always run Lighthouse audits inside a fresh Incognito window (press Ctrl + Shift + N on Windows or Cmd + Shift + N on macOS). This prevents browser extensions (such as ad blockers or password managers) from injecting external JavaScript that artificially inflates loading times.
Navigate to Your Target Page: Load the specific URL or staging endpoint you wish to analyze.
Open Chrome Developer Tools: Right-click anywhere on the webpage and select Inspect, or press F12 (Cmd + Option + I on Mac).
Select the "Lighthouse" Tab: Locate the Lighthouse tab in the top menu bar of DevTools.
Configure Audit Parameters:
Mode: Choose Navigation (standard page load).
Device: Toggle between Mobile (simulated mid-tier mobile processor with 4G throttling) or Desktop (unthrottled hardware).
Categories: Select Performance, Accessibility, Best Practices, SEO, and PWA.
Generate Audit Report: Click Analyze page load. Chrome will refresh your page under emulated CPU throttling and present a real-time audit score from 0 to 100 across all categories.
When to Use Chrome DevTools Lighthouse
Lighthouse is the ultimate tool during active development. Because it runs locally, you can audit unreleased code on https://www.moocky.tn, private staging environments, or password-protected client previews before pushing to production.
Part 2: Understanding Google PageSpeed Insights (web.dev)
Google PageSpeed Insights (PSI) is Google's web-based diagnostic suite located at https://pagespeed.web.dev/. Unlike local DevTools Lighthouse audits, PageSpeed Insights evaluates public URLs using Google's cloud server infrastructure and incorporates real-world user metrics.
How PageSpeed Insights Operates
Go to https://pagespeed.web.dev/.
Paste your fully qualified domain URL (e.g., https://moocky.tn).
Click Analyze.
Review the dual reports for Mobile and Desktop environments.
PageSpeed Insights divides its report into two crucial datasets:
Lab Data (Synthetic Testing): Generated in real-time by running Lighthouse on Google's cloud servers under standardized 4G network throttling.
Field Data (Real-User Metrics / CrUX): Aggregated data from actual human visitors over the past 28 days via the Chrome User Experience Report (CrUX).
Part 3: Key Differences: Lighthouse vs. PageSpeed Insights
To choose the right tool for your engineering team, compare their key operational parameters below:
Test Execution Environment:
Google Chrome DevTools Lighthouse: Local browser & client device hardware.
Google PageSpeed Insights: Google cloud server testing infrastructure.
Data Source:
Google Chrome DevTools Lighthouse: Lab Data Only (Synthetic simulation).
Google PageSpeed Insights: Lab Data + Real-World Field Data (CrUX).
Real User Analytics (CrUX):
Google Chrome DevTools Lighthouse: Not Available.
Google PageSpeed Insights: Included (28-day historical field data).
Local / Staging URL Testing:
Google Chrome DevTools Lighthouse: Yes (Works on https://www.moocky.tn & local builds).
Google PageSpeed Insights: No (Requires publicly accessible URLs).
Network Throttling Model:
Google Chrome DevTools Lighthouse: Emulated by local CPU & connection speed.
Google PageSpeed Insights: Standardized Google cloud network throttling.
Google Search Ranking Influence:
Google Chrome DevTools Lighthouse: Diagnostic tool (Indirect feedback).
Google PageSpeed Insights: Official assessment for Google Core Web Vitals.
Part 4: Why Scores Differ Between Lighthouse & PageSpeed Insights
It is common for developers to record a perfect 100/100 score in local Chrome Lighthouse, only to observe a 92/100 score on PageSpeed Insights. This variance stems from three primary factors:
Hardware Differences: Local Lighthouse utilizes your laptop’s powerful M-series or Intel/AMD processor. PageSpeed Insights simulates a mid-range mobile CPU on a standardized server node.
Field Data Integration (CrUX): PageSpeed Insights incorporates actual user interactions over 28 days. If your real users visit your site over slow 3G networks or older mobile devices, your overall Core Web Vitals status will reflect that reality.
Network Latency & Server Location: Local Lighthouse tests directly against your nearest server edge, whereas PageSpeed Insights requests pages from Google testing data centers.
Part 5: Core Web Vitals & Optimization Best Practices
To maintain consistent 100/100 performance scores across both diagnostic tools, focus on optimizing the three core Google metrics:
Largest Contentful Paint (LCP): Measures main content loading speed. Keep LCP under 2.5 seconds by utilizing modern image formats (WebP/AVIF), implementing Next.js Server Components (RSC), and preloading critical hero assets.
Interaction to Next Paint (INP): Measures page responsiveness to user clicks. Keep INP under 200 milliseconds by minimizing heavy JavaScript execution on the main thread and deferring non-essential scripts.
Cumulative Layout Shift (CLS): Measures visual stability. Eliminate CLS by specifying explicit width and height attributes on images and video containers to prevent layout jumps during rendering.
Conclusion
Both Google Chrome DevTools Lighthouse and Google PageSpeed Insights are essential tools in modern web development:
Use Chrome DevTools Lighthouse during active development to catch regression bugs and audit staging builds locally.
Use PageSpeed Insights to validate production readiness, track real-world user metrics (CrUX), and safeguard your technical SEO rankings.
At Moocky, every corporate website, e-commerce platform, and SaaS MVP we build is engineered from the ground up to achieve top-tier performance scores and rank effortlessly on search engines.